Today I met a lady who takes up multiple jobs. She works as a production line worker on weekdays and a masseur on weekend. Candidly yet poignantly, she told me that life is going to be more and more difficult in the next 5 years as Globalization extends its tentacles further.Ending off our conversation, she expressed hope that her children who are in ITE can survive in today's competitive world. As someone who is supposedly educated and wealthier, I am ashamed to say that I sub-consciously chose to see only the benefits of Globalization.With a rich consumers' mindset, I am only concerned whether goods and services will get cheaper with outsourcing taking place to India, China, Indonesia, Vietnam, Mexico etc . I have forgotten that the poor will be hit the hardest by globaliztion. This is so as these low skilled workers jobs are slowly lost when companies shift their production elsewhere.This leaves people like the lady whom I met jobless. As much as I know the pros and cons about Globalization as an Economics teacher, today's conversation reminded me that all is true and happening around us. They are not just stories from textbooks.....While as much as I see the benefits of globalization, I do hope that more are done to alleviate the plight of the poor.
I accidentally yet coincidentally, I stumbled upon this video.Hope you guys learn something about Globalization!
Saturday, April 7, 2007
Defending Globalization


Tuesday, April 3, 2007
Dangerous Ideas! Beware!
While I enjoyed this week's lessons on drawing of demand and supply graphs so far. I have come to notice that students have some dangerous ideas lurking in their minds.
Dangerous idea #1: An increase in Demand, ceteris paribus, will cause Supply to
increase.
This is absolutely something we want to avoid. What you guys actually meant is that an increase in demand will cause quantity supplied to increase. Take a look at the following diagrams.

Fig 1 shows that when demand curve shifts from D to D1, price increases from P1 to P2. Upon seeing a higher price, producers will have more incentive to increase production. This leads to an increase in quantity (supplied) from Q1 to Q2. Now, take a close look at Fig 2. It is actually the same supply seen in Fig1 without the demand curves.
Can you see that there as price increases from P1 to P2, there is an increase in quantity supplied from Q1 to Q2?
Henceforth, once again, an increase in demand, ceteris paribus, will cause quantity supplied to increase.
Dangerous Idea #2: An increase in supply, ceteris paribus, will cause demand to increase.
This dangerous idea is similar to the above. Therefore, the explanation to debunk such dangerous idea is the same as discussed above. (Please try out the explanation yourself). The correct understanding should be an increase in supply, ceteris paribus, will cause quantity demanded to increase.
Dangerous idea #1: An increase in Demand, ceteris paribus, will cause Supply to
increase.
This is absolutely something we want to avoid. What you guys actually meant is that an increase in demand will cause quantity supplied to increase. Take a look at the following diagrams.
Fig 1 shows that when demand curve shifts from D to D1, price increases from P1 to P2. Upon seeing a higher price, producers will have more incentive to increase production. This leads to an increase in quantity (supplied) from Q1 to Q2. Now, take a close look at Fig 2. It is actually the same supply seen in Fig1 without the demand curves.
Can you see that there as price increases from P1 to P2, there is an increase in quantity supplied from Q1 to Q2?
Henceforth, once again, an increase in demand, ceteris paribus, will cause quantity supplied to increase.
Dangerous Idea #2: An increase in supply, ceteris paribus, will cause demand to increase.
This dangerous idea is similar to the above. Therefore, the explanation to debunk such dangerous idea is the same as discussed above. (Please try out the explanation yourself). The correct understanding should be an increase in supply, ceteris paribus, will cause quantity demanded to increase.
Guidelines on how to write an analysis on Demand & Supply
To all students,
I am happy that most of you are able to follow the topic on Supply, Demand and Price Determination. Most of you manage to draw the Supply/Demand diagram correctly by shifting the curves accordingly to changes in factors.
You guys have excellent thinking! Keep it up!
However, I am concerned of how you guys explain your illustrations in words. In fact, many of you have voiced concern on how to explain what have been illustrated on your graphs for essays and short structured questions. Some of you are also caught off guard by the use of technical terms such as “shifts”, “movement”, “quantity demanded”, “quantity supplied”, “downwards/upwards pressure” and so on. To address such concern, I have decided to give you some guidelines to make your explanation clearer and more “sophisticated”.
However, I must stress that the guidelines are not the best. You can always try to explain in your own way. Remember, they are just guidelines. For simplicity, I will be using the example below in my entire demonstration:
Eg: Oil price is expected to go up next week
Step 1: Always state the effect of the change and which curve should shift
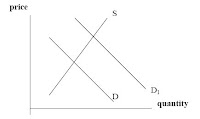
As people expect oil price to go up next week, this will increase their willingness to buy oil now so that they would be able to avoid paying a higher price later. This will increase their demand for oil now and shift demand curve to the right.
I am happy that most of you are able to follow the topic on Supply, Demand and Price Determination. Most of you manage to draw the Supply/Demand diagram correctly by shifting the curves accordingly to changes in factors.
You guys have excellent thinking! Keep it up!
However, I am concerned of how you guys explain your illustrations in words. In fact, many of you have voiced concern on how to explain what have been illustrated on your graphs for essays and short structured questions. Some of you are also caught off guard by the use of technical terms such as “shifts”, “movement”, “quantity demanded”, “quantity supplied”, “downwards/upwards pressure” and so on. To address such concern, I have decided to give you some guidelines to make your explanation clearer and more “sophisticated”.
However, I must stress that the guidelines are not the best. You can always try to explain in your own way. Remember, they are just guidelines. For simplicity, I will be using the example below in my entire demonstration:
Eg: Oil price is expected to go up next week
Step 1: Always state the effect of the change and which curve should shift
As people expect oil price to go up next week, this will increase their willingness to buy oil now so that they would be able to avoid paying a higher price later. This will increase their demand for oil now and shift demand curve to the right.
Step 2 (And Very Impt!!!):
Always hold price at “old price” and describe how the price mechanism works to achieve a new equilibrium
 At the old price of Pold, the market is in disequilibrium. At Pold, Qss is less than QDD, hence there is a shortage. Consumers would be unable to obtain all they wanted would be willing to pay a higher price. Producer, unable or unwilling to supply enough will be happy to accept a higher price. This creates an upwards pressure on price. As price rises quantity demanded falls and quantity supplied rises. The rise in price will stop at P1 where Qss eventually equal QDD. Shortage is eliminated at Q1.
Step 3:
Simply state the equilibrium price and equilibrium quantity
Henceforth equilibrium price is P1 and equilibrium quantity is Q1
Always hold price at “old price” and describe how the price mechanism works to achieve a new equilibrium
At the old price of Pold, the market is in disequilibrium. At Pold, Qss is less than QDD, hence there is a shortage. Consumers would be unable to obtain all they wanted would be willing to pay a higher price. Producer, unable or unwilling to supply enough will be happy to accept a higher price. This creates an upwards pressure on price. As price rises quantity demanded falls and quantity supplied rises. The rise in price will stop at P1 where Qss eventually equal QDD. Shortage is eliminated at Q1.Step 3:
Simply state the equilibrium price and equilibrium quantity
Henceforth equilibrium price is P1 and equilibrium quantity is Q1
Wednesday, March 21, 2007
Why Study Economics
Why study Economics?
Top reasons to study Economics
1. Economists are armed and dangerous: "Watch out for our invisible hands."
2. Economists can supply it on demand.
3. You can talk about money without every having to make any.
4. Mick Jagger and Arnold Schwarzenegger both studied economics and look how they turned out.
5. When you are in the unemployment line, at least you will know why you are there.
6. If you rearrange the letters in "ECONOMICS", you get "COMIC NOSE".
7. Although ethics teaches that virtue is its own reward, in economics we get taught that reward is its own virtue.
8. When you get drunk, you can tell everyone that you are just researching the law of diminishing marginal utility.
9. When you call 1-900-LUV-ECON and get Kandi Keynes, you will have something to talk about.
Top reasons to study Economics
1. Economists are armed and dangerous: "Watch out for our invisible hands."
2. Economists can supply it on demand.
3. You can talk about money without every having to make any.
4. Mick Jagger and Arnold Schwarzenegger both studied economics and look how they turned out.
5. When you are in the unemployment line, at least you will know why you are there.
6. If you rearrange the letters in "ECONOMICS", you get "COMIC NOSE".
7. Although ethics teaches that virtue is its own reward, in economics we get taught that reward is its own virtue.
8. When you get drunk, you can tell everyone that you are just researching the law of diminishing marginal utility.
9. When you call 1-900-LUV-ECON and get Kandi Keynes, you will have something to talk about.
Monday, March 5, 2007
Fishball
Cute!! Interesting to find out why a bowl of 6 fishballs and 6 beefballs are solld@ HK$20 respectively whereas a bowl of 3 fishballs and 3 beefballs is sold@ HK$22. IT IS ALL ABOUT DEMAND! Might go through the concept discussed one day in class....
(But for those who understands Cantonese! Canto speakers you might want to help translate the content to your non-canto speaking frenz)
Factors Affecting Supply
As I do not think it is nice to leave discussion on the on the supply side, I have decided to put in an entry on some NON PRICE FACTORS affecting supply. (NB: Non-price supply factors will result in a shift of supply curve graphically)
Here it goes!
FACTORS AFFECTING SUPPLY OF A PRODUCT
(a) State of technology
Technological changes take place over time as a result of innovation and enterprise. With improved production methods, output of goods would go up, thus giving rise to increases in supply.
(b) Prices of factor inputs
The price at which producers are willing and able to sell output depends on the costs of factors, including wages, rent payments, fuel, interest rates and raw material prices. If factor prices increase, then the costs of producing the same quantity of the good also increases, so producers need to cut back on supply, even though the price of the good itself has not changed. The effect of this increase in the costs of production shifts the supply curve to the left.
d) Prices of related goods
Changes in the prices of other related goods may affect the supply of a commodity whose price does not change. If the prices of other goods increase, the production of these goods will become more profitable, and resources would tend to move towards the industries making these higher-priced commodities. The production of goods, with prices unchanged, would now be less attractive to suppliers.
e) Government policy
The imposition of indirect taxes and granting of subsidies will bring about changes in supply. A tax imposed on a good increases the cost of supplying that good, forcing suppliers to cut back on production. Subsidies have the opposite effect; they lower the costs of production and supply is increased.
f) Number of suppliers
More suppliers increase supply. On the other hand, if suppliers leave the industry, market supply will fall.
g) Weather conditionsThe output of agricultural products is determined by variations in the weather. Favourable weather conditions can increase supply while poor conditions would bring about decreases in supply
Here it goes!
FACTORS AFFECTING SUPPLY OF A PRODUCT
(a) State of technology
Technological changes take place over time as a result of innovation and enterprise. With improved production methods, output of goods would go up, thus giving rise to increases in supply.
(b) Prices of factor inputs
The price at which producers are willing and able to sell output depends on the costs of factors, including wages, rent payments, fuel, interest rates and raw material prices. If factor prices increase, then the costs of producing the same quantity of the good also increases, so producers need to cut back on supply, even though the price of the good itself has not changed. The effect of this increase in the costs of production shifts the supply curve to the left.
d) Prices of related goods
Changes in the prices of other related goods may affect the supply of a commodity whose price does not change. If the prices of other goods increase, the production of these goods will become more profitable, and resources would tend to move towards the industries making these higher-priced commodities. The production of goods, with prices unchanged, would now be less attractive to suppliers.
e) Government policy
The imposition of indirect taxes and granting of subsidies will bring about changes in supply. A tax imposed on a good increases the cost of supplying that good, forcing suppliers to cut back on production. Subsidies have the opposite effect; they lower the costs of production and supply is increased.
f) Number of suppliers
More suppliers increase supply. On the other hand, if suppliers leave the industry, market supply will fall.
g) Weather conditionsThe output of agricultural products is determined by variations in the weather. Favourable weather conditions can increase supply while poor conditions would bring about decreases in supply
Factors Affecting Demand
Hi!
As many of you have requested for the notes on NON-PRICE FACTORS affecting demand, I have decided to put up this entry. (NB:non-price factors result in a shift of the demand curve graphically). I have tried to cut down on the words but tried to retain the essence of the explanation as much as possible. Hope you guys find it useful!
(a) Prices and demand of related products
i. Substitute(s)
A substitute product is an alternative product that can replace another because it satisfies the same want. Examples of substitutes include coffee & tea and public buses & the MRT. If the price of tea changes, demand for coffee will change in the same direction eg a rise in tea prices causes a fall in the quantity demanded for tea and a rise in demand for coffee, even though the price of coffee itself has not changed.
ii. Complement(s)
A complementary product is one which must be used at the same time with another to satisfy the same human wants eg coffee and milk and petrol & cars. If petrol prices rise, demand for cars will change in the opposite direction (though the prices of cars have not risen, people find it more expensive to own cars, resulting in a fall in its demand). Complements are said to be goods that are jointly demanded.
(a) Consumers’ money income
i. Normal goods
These are goods whose demand rise with a rise in money income of consumers and vice versa. ie we buy more electronic gadgets, clothes and travel more when our incomes rise.
ii. Inferior goods
These are goods whose demand vary inversely with consumers’ money income. For instance Pentium 1 computers and fans. Consumers prefer less of such goods when their incomes grow.
(b) Consumers’ tastes and preferences
Consumers' tastes and preferences are influenced by their income, peers, advertisements, pop-star appeal, age, sex, culture etc. Changes in consumers’ tastes in favour of (or against) a good/service will raise (or reduce) its demand.
(c) Expectations of future price changes
The fear or expectation of a future price rise will induce people to buy more now thus raising demand for the good (consumer durables) concerned. If they expect the price to fall in future, they will postpone their purchases now thus reducing demand for the good concerned.
(d) Availability of credit facilities and hire purchases
Easy credit facilities eg. availability of low interest loans and favourable terms offered by banks makes the cost of borrowing funds or spending on credit more attractive. This would raise the demand for loans to encourage consumption of, and demand for, goods and services.
Less stringent hire purchase terms eg. longer repayment periods and smaller downpayment sum will allow more consumers the ability to buy the products now and encourage more purchases and thereby raising demand for goods such as cars, household appliances etc.
(e) Size and composition of population
A fast-growing population will demand more of most goods and services, other things held constant. Increased proportion of teenagers will raise demand for commodities that appeal to this age group eg. sports gear, fashion wear etc.
Increased birth rates will result in higher demand for baby-related goods while a rapidly greying population will mean higher demand for medical services, dentures, walking sticks etc.
(f) Seasonal factors
The demand for many goods and services such as clothing, food, water, healthcare and travel is influenced by seasonal climatic conditions.
“In the month of January, around the island of Singapore, heavy downpours have boosted businesses for some and caused havoc for others.” ST 15/1/06.
What were some of these affected businesses?
Did the changes represent a movement along, or shift of, the demand curves of these goods services?
(g) Government distribution of income
A reduction in personal income tax rates will result in greater disposable income and encourage the consumption of goods and services. On the other hand, an increase in GST tends to reduce the consumption of goods and services.
A progressive tax system (by taxing the rich more heavily) and giving subsidies to the poor will redistribute income in favour of the lower income group, thus their demand for other goods besides basic necessities may rise eg better food and housing.
(h) Other government economic policies
Anti-smoking campaigns, car ownership schemes eg. Certificates of Entitlement (COE) and Electronic Road Pricing (ERP), housing grants and the Economic Restructuring Shares are further examples of government policies that affect demand for related goods and services.
As many of you have requested for the notes on NON-PRICE FACTORS affecting demand, I have decided to put up this entry. (NB:non-price factors result in a shift of the demand curve graphically). I have tried to cut down on the words but tried to retain the essence of the explanation as much as possible. Hope you guys find it useful!
(a) Prices and demand of related products
i. Substitute(s)
A substitute product is an alternative product that can replace another because it satisfies the same want. Examples of substitutes include coffee & tea and public buses & the MRT. If the price of tea changes, demand for coffee will change in the same direction eg a rise in tea prices causes a fall in the quantity demanded for tea and a rise in demand for coffee, even though the price of coffee itself has not changed.
ii. Complement(s)
A complementary product is one which must be used at the same time with another to satisfy the same human wants eg coffee and milk and petrol & cars. If petrol prices rise, demand for cars will change in the opposite direction (though the prices of cars have not risen, people find it more expensive to own cars, resulting in a fall in its demand). Complements are said to be goods that are jointly demanded.
(a) Consumers’ money income
i. Normal goods
These are goods whose demand rise with a rise in money income of consumers and vice versa. ie we buy more electronic gadgets, clothes and travel more when our incomes rise.
ii. Inferior goods
These are goods whose demand vary inversely with consumers’ money income. For instance Pentium 1 computers and fans. Consumers prefer less of such goods when their incomes grow.
(b) Consumers’ tastes and preferences
Consumers' tastes and preferences are influenced by their income, peers, advertisements, pop-star appeal, age, sex, culture etc. Changes in consumers’ tastes in favour of (or against) a good/service will raise (or reduce) its demand.
(c) Expectations of future price changes
The fear or expectation of a future price rise will induce people to buy more now thus raising demand for the good (consumer durables) concerned. If they expect the price to fall in future, they will postpone their purchases now thus reducing demand for the good concerned.
(d) Availability of credit facilities and hire purchases
Easy credit facilities eg. availability of low interest loans and favourable terms offered by banks makes the cost of borrowing funds or spending on credit more attractive. This would raise the demand for loans to encourage consumption of, and demand for, goods and services.
Less stringent hire purchase terms eg. longer repayment periods and smaller downpayment sum will allow more consumers the ability to buy the products now and encourage more purchases and thereby raising demand for goods such as cars, household appliances etc.
(e) Size and composition of population
A fast-growing population will demand more of most goods and services, other things held constant. Increased proportion of teenagers will raise demand for commodities that appeal to this age group eg. sports gear, fashion wear etc.
Increased birth rates will result in higher demand for baby-related goods while a rapidly greying population will mean higher demand for medical services, dentures, walking sticks etc.
(f) Seasonal factors
The demand for many goods and services such as clothing, food, water, healthcare and travel is influenced by seasonal climatic conditions.
“In the month of January, around the island of Singapore, heavy downpours have boosted businesses for some and caused havoc for others.” ST 15/1/06.
What were some of these affected businesses?
Did the changes represent a movement along, or shift of, the demand curves of these goods services?
(g) Government distribution of income
A reduction in personal income tax rates will result in greater disposable income and encourage the consumption of goods and services. On the other hand, an increase in GST tends to reduce the consumption of goods and services.
A progressive tax system (by taxing the rich more heavily) and giving subsidies to the poor will redistribute income in favour of the lower income group, thus their demand for other goods besides basic necessities may rise eg better food and housing.
(h) Other government economic policies
Anti-smoking campaigns, car ownership schemes eg. Certificates of Entitlement (COE) and Electronic Road Pricing (ERP), housing grants and the Economic Restructuring Shares are further examples of government policies that affect demand for related goods and services.
Subscribe to:
Posts (Atom)
