Economics is about making the right choice. Find out what economist think the next big thing is for people to capitalise on and get rich from in this 21 century. Watch this video! You might be making the right choice...
Ride The Wave - These bloopers are hilarious
Tuesday, April 17, 2007
Survey to win iPod!
Hi students,
An international survey is being undertaken into students' perceptions of economics. It is being conducted by Andrew Mearman (UWE, Bristol) and Tim Wakeley (Griffith University, Australia) as part of the mini- project funded by Economics Network. The major goal of the survey is to ascertain students' perception of the economics discipline and to identify factors which influence those perceptions so as to improve curriculum design, improve recruitment, retention and overall satisfaction with economics.
All students taking part will have the option to enter a prize draw to win an iPod.The survey can be completed online until 30.08.07. Students wishing to complete the survey should go to http://www.survey.bris.ac.uk/ltsn/perceptions.
Monday, April 9, 2007
Tomatoes!
Hi all, this is an impromptu attempt to come out with a worksheet to teach price elasticity of demand. YIKES!!
As you guys know that your test on Demand, Supple and Price Elasticity of Demand is just round the corner, I would very much like to start looking at the application and analysis on price elasticity of demand with this article on “Tomatoes”!
Please do me as well as you a favour by reading the following articles and try to answer the following questions. But of course, have your notes with you as you attempt those questions.
NB: You are strongly encouraged to download the article so that we can discuss in class.
Tomatoes: A star is grown
A national advertising campaign is set to begin promoting the humble fruit's virtues.
By TOM ZUCCO, Times Staff Writer
Published January 25, 2006
A national advertising campaign is set to begin promoting the humble fruit's virtues.
By TOM ZUCCO, Times Staff Writer
Published January 25, 2006
 [Times photo: Bill Serne]
John M. Jack oversees tomatoes as they run through a vat of chlorinated water to be cleaned and sanitized at West Coast Tomato in Palmetto.
It's red, round, a little seedy, and as much as a fruit can be, about to become a national TV star.
For the first time in its 50-year history, the Florida Tomato Committee on Monday will begin a national ad campaign touting the virtues of the Florida tomato.
Four 15-second spots will repeat 600 times over the next 21/2 months on The Food Network, Discovery Health, DIY (Do It Yourself) and other cable channels. The $500,000 campaign is aimed at women age 25 to 54 and was developed by SenaReider, an ad agency based in San Francisco.
The ads are relatively simple, but not dull. One spot shows a picture of a stunningly plump tomato with a female voiceover:
"A whole tomato contains only five grams of carbs, no cholesterol, and was once thought to be an aphrodisiac.
"Fresh, Florida tomatoes.
"You're into that ... aren't you?"
Cute. But to Florida's nearly 125 commercial tomato growers, the messages have a deeper importance.
Virtually all the field-grown tomatoes in the United States sold from December through May each year come from Florida. For the entire year, the state accounts for about 1.5-billion pounds of tomatoes, or 50 percent of all of the domestically produced tomatoes sold in the country.
The 2004-05 hurricane seasons, however, put Florida tomato farmers in a pickle. The storms wiped out many fields and sent the price of tomatoes to triple in some cases. Some restaurants, including Wendy's, were forced to take tomatoes off their menus or make tomatoes available only upon request.
After each hurricane season passed, Florida growers replanted quickly and got their shipments into stores. However, this did not bring good news to the growers as prices started to fall. There was a tomato glut in 2004 and again last year. The price sank so low early last year it was cheaper for growers to let their tomatoes die on the vine than to pick, wash and ship them for sale. Farmers wound up donating more than 700,000 pounds of tomatoes, in part to draw attention to their surplus.
This is where the ad campaign comes in. The spots praise the fruit's succulence and health benefits, and also include much-needed handling messages. The ads are also designed to bring retailers into the campaign.
"It takes a little time," Samantha Winters, director of education and promotion for the Tomato Committee, said of the effort to inform the public. "We want people to know prices are coming down, the crop is here, and we're excited about this season.
"The tomato," she said, "is the big hero."
Questions:
- Using demand and supply diagram, illustrate how the market for tomatoes was affected when hurricane hit Florida in 2004-05.
- Explain why restaurants owners are either taking tomatoes off their menus or only serving upon requests?
- Using the concept of price elasticity of demand, explain why the increase in the supply of tomatoes did not bring good news to the growers at all.
- Explain the reason behind the Florida Tomato Committee’s decision of launching the ad campaign. How successful do you think this ad campaign will be in helping the tomato growers.
Sunday, April 8, 2007
Demand Supply, Groundwater and Public Policy
This video explains how government's water conservation policies can help to decrease the demand and increase the supply of water in today's world where water is becoming more precious and scarce. Determine how would the demand and supply curves be affected after imposing the water conservation policies are imposed.
Note: the issue of water conservation is very real and urgent! Please do your part to help our Planet Earth. Planet Earth needs our help.
Saturday, April 7, 2007
Defending Globalization
Today I met a lady who takes up multiple jobs. She works as a production line worker on weekdays and a masseur on weekend. Candidly yet poignantly, she told me that life is going to be more and more difficult in the next 5 years as Globalization extends its tentacles further.Ending off our conversation, she expressed hope that her children who are in ITE can survive in today's competitive world. As someone who is supposedly educated and wealthier, I am ashamed to say that I sub-consciously chose to see only the benefits of Globalization.With a rich consumers' mindset, I am only concerned whether goods and services will get cheaper with outsourcing taking place to India, China, Indonesia, Vietnam, Mexico etc . I have forgotten that the poor will be hit the hardest by globaliztion. This is so as these low skilled workers jobs are slowly lost when companies shift their production elsewhere.This leaves people like the lady whom I met jobless. As much as I know the pros and cons about Globalization as an Economics teacher, today's conversation reminded me that all is true and happening around us. They are not just stories from textbooks.....While as much as I see the benefits of globalization, I do hope that more are done to alleviate the plight of the poor.
I accidentally yet coincidentally, I stumbled upon this video.Hope you guys learn something about Globalization!
Tuesday, April 3, 2007
Dangerous Ideas! Beware!
While I enjoyed this week's lessons on drawing of demand and supply graphs so far. I have come to notice that students have some dangerous ideas lurking in their minds.
Dangerous idea #1: An increase in Demand, ceteris paribus, will cause Supply to
increase.
This is absolutely something we want to avoid. What you guys actually meant is that an increase in demand will cause quantity supplied to increase. Take a look at the following diagrams.

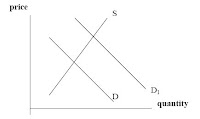
Fig 1 shows that when demand curve shifts from D to D1, price increases from P1 to P2. Upon seeing a higher price, producers will have more incentive to increase production. This leads to an increase in quantity (supplied) from Q1 to Q2. Now, take a close look at Fig 2. It is actually the same supply seen in Fig1 without the demand curves.
Can you see that there as price increases from P1 to P2, there is an increase in quantity supplied from Q1 to Q2?
Henceforth, once again, an increase in demand, ceteris paribus, will cause quantity supplied to increase.
Dangerous Idea #2: An increase in supply, ceteris paribus, will cause demand to increase.
This dangerous idea is similar to the above. Therefore, the explanation to debunk such dangerous idea is the same as discussed above. (Please try out the explanation yourself). The correct understanding should be an increase in supply, ceteris paribus, will cause quantity demanded to increase.
Dangerous idea #1: An increase in Demand, ceteris paribus, will cause Supply to
increase.
This is absolutely something we want to avoid. What you guys actually meant is that an increase in demand will cause quantity supplied to increase. Take a look at the following diagrams.
Fig 1 shows that when demand curve shifts from D to D1, price increases from P1 to P2. Upon seeing a higher price, producers will have more incentive to increase production. This leads to an increase in quantity (supplied) from Q1 to Q2. Now, take a close look at Fig 2. It is actually the same supply seen in Fig1 without the demand curves.
Can you see that there as price increases from P1 to P2, there is an increase in quantity supplied from Q1 to Q2?
Henceforth, once again, an increase in demand, ceteris paribus, will cause quantity supplied to increase.
Dangerous Idea #2: An increase in supply, ceteris paribus, will cause demand to increase.
This dangerous idea is similar to the above. Therefore, the explanation to debunk such dangerous idea is the same as discussed above. (Please try out the explanation yourself). The correct understanding should be an increase in supply, ceteris paribus, will cause quantity demanded to increase.
Guidelines on how to write an analysis on Demand & Supply
To all students,
I am happy that most of you are able to follow the topic on Supply, Demand and Price Determination. Most of you manage to draw the Supply/Demand diagram correctly by shifting the curves accordingly to changes in factors.
You guys have excellent thinking! Keep it up!
However, I am concerned of how you guys explain your illustrations in words. In fact, many of you have voiced concern on how to explain what have been illustrated on your graphs for essays and short structured questions. Some of you are also caught off guard by the use of technical terms such as “shifts”, “movement”, “quantity demanded”, “quantity supplied”, “downwards/upwards pressure” and so on. To address such concern, I have decided to give you some guidelines to make your explanation clearer and more “sophisticated”.
However, I must stress that the guidelines are not the best. You can always try to explain in your own way. Remember, they are just guidelines. For simplicity, I will be using the example below in my entire demonstration:
Eg: Oil price is expected to go up next week
Step 1: Always state the effect of the change and which curve should shift
As people expect oil price to go up next week, this will increase their willingness to buy oil now so that they would be able to avoid paying a higher price later. This will increase their demand for oil now and shift demand curve to the right.
Step 2 (And Very Impt!!!):
Always hold price at “old price” and describe how the price mechanism works to achieve a new equilibrium
 At the old price of Pold, the market is in disequilibrium. At Pold, Qss is less than QDD, hence there is a shortage. Consumers would be unable to obtain all they wanted would be willing to pay a higher price. Producer, unable or unwilling to supply enough will be happy to accept a higher price. This creates an upwards pressure on price. As price rises quantity demanded falls and quantity supplied rises. The rise in price will stop at P1 where Qss eventually equal QDD. Shortage is eliminated at Q1.
Step 3:
Simply state the equilibrium price and equilibrium quantity
Henceforth equilibrium price is P1 and equilibrium quantity is Q1
Always hold price at “old price” and describe how the price mechanism works to achieve a new equilibrium
At the old price of Pold, the market is in disequilibrium. At Pold, Qss is less than QDD, hence there is a shortage. Consumers would be unable to obtain all they wanted would be willing to pay a higher price. Producer, unable or unwilling to supply enough will be happy to accept a higher price. This creates an upwards pressure on price. As price rises quantity demanded falls and quantity supplied rises. The rise in price will stop at P1 where Qss eventually equal QDD. Shortage is eliminated at Q1.Step 3:
Simply state the equilibrium price and equilibrium quantity
Henceforth equilibrium price is P1 and equilibrium quantity is Q1
Subscribe to:
Posts (Atom)
